


PLANNING WITH SYNOPTRA IN A PROJECT
<< backAcquisition of topographic data
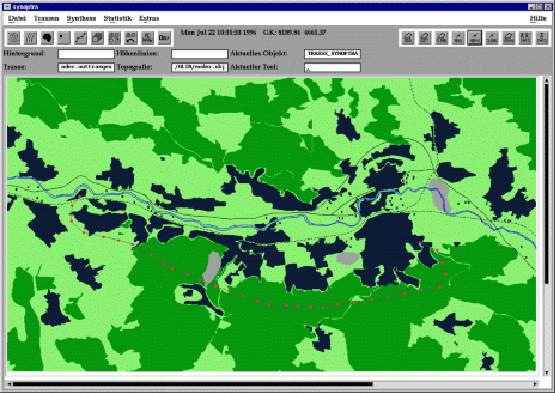
Acquisition of topographic data is an easy task with the graphical user interface of synoptra. You simply follow lines of streets and rivers or click the contour of areas such as forest, lakes, or inhabited areas. Then it is necessary to add some information like height of a forest or define values for approval ability. Furthermore textures (i.e. pictures of trees) can be added for synoptraIMAGE to create highly realistic pictures of freely definable observer points. Figure 1 shows the interface with digitized data. The example shown is part of an area between Endersbach and Schorndorf in the south of Germany. During this project several variants of a planned overhead line were compared with synoptaANALYSE.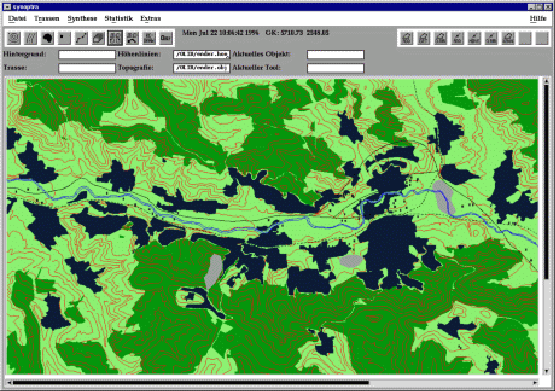
Presentation of results of the analysis
Results of optimisation and visibility analysis can easily be visualized with synoptra.Results of optimisation
During optimisation - which is based on a probabilistic method - variants of overhead lines are generated that become better and better. Figure 2 shows the progress of costs, figure 3 progress of approval ability of the best variant in the course of generations.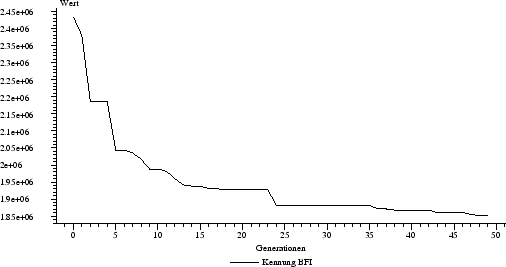
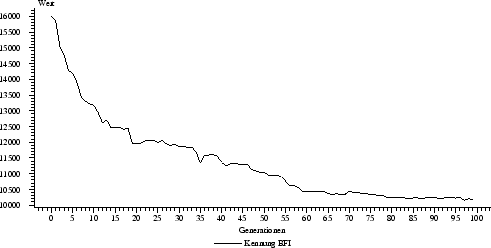
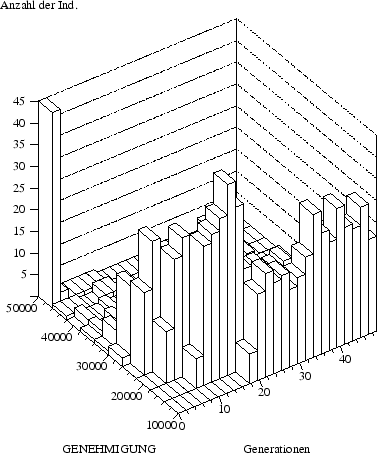
Figure 4 shows the evolution of all individuals in a population over the generation. It shows that the optimisation is succeeds in improving the quality as the number of better individuals increases in the course of the optimisation.
Overhead lines generated during optimisation
This chapter shows the overhead lines that arose during the evolution. Figure 5 shows the track of the best variant of the initial population, figure 6 the one of population 50 of the final optimisation (weight of costs: 0.25, weight of approval ability: 0.25, weight of visibility: 0.5).
Two aspects become evident:
- Already in initial population an individual arose that is well suited for solving the given problem: Protected areas are widely avoided (inhabited areas, nature reserves) and zones of low visibility are preferred (which is the case for the forests represented in green color).
- Nevertheless improvements are realized in the course of optimisation. This becomes evident as the number of span poles are reduced (lower costs) and by a complete drive around protected areas. Visibility was also improved by reducing the number of pylons.